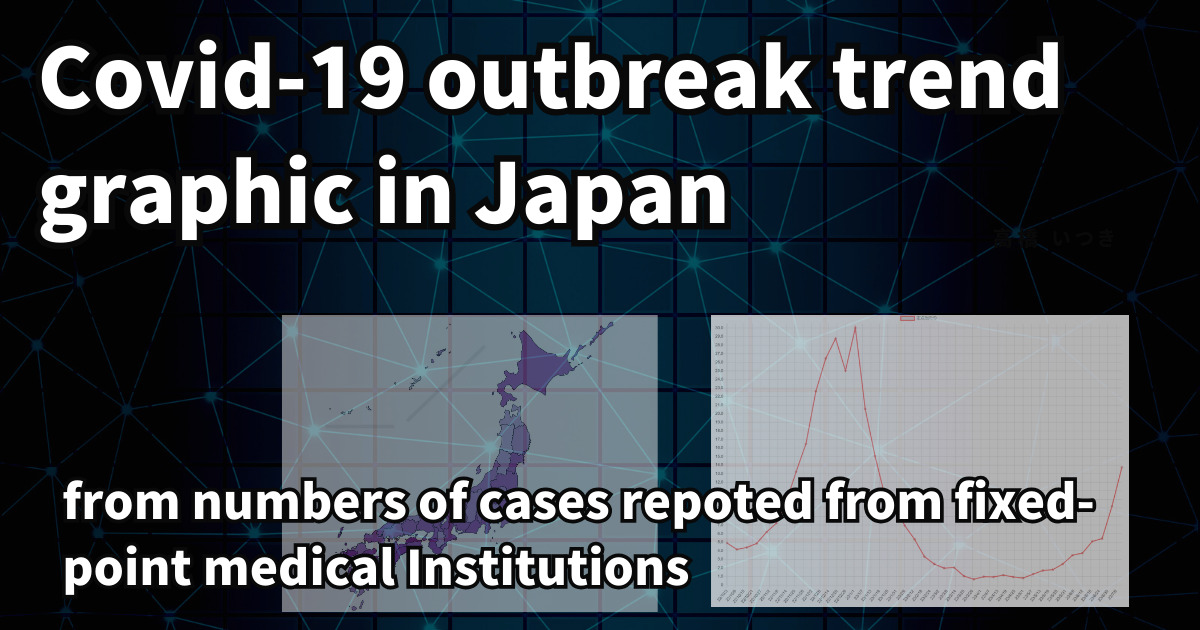
Charts below are the surveillance reports from fixed-point medical Institutions per-prefecture, released every Friday by the Ministry of Health, Labor and Welfare(MHLW, ‘KouRouShou’).
The data of the number of hospitalized patients has been replaced by the number of hospitalized patients from the Core Fixed Point Surveillance because the data of the number of hospitalized patients is no longer publicly available. Data from the National Institute of Infectious Disease Control Weekly Report (IDWR) are used.
Click any prefecture, then both Cases and Core fixed-point Hospitalization are shown in Charts.
[Data until 2025 week 20 (2025/5/12~5/18)]
Data for core fixed-point admissions through week 19, 2025.
*The number of hospitalizations at key sentinel hospitals currently displayed is 1 week behind the number of patients.
Tap one of the boxes below to change the graphic based on the number of new cases per fixed point.
[View Chart for Whole Japan]
Tap a prefecture on the map, and the chart for that prefecture will appear below.
How to operate and see color coding
- Tap a prefecture on the map, and the chart for that prefecture will appear below.
*If the map is too small to press, you can expand it by spreading your finger to make it easier to press. - Tap “View Chart for Whole Japan” below the map for a national chart.
- Tap [This week/Last week] [Last week/Previous week], and you will see a darker color for the prefectures that had more than the previous week, i.e., the prefectures with “rapidly increasing infections”.

- When you tap [This week/Week beginning May 8] [Last week/Week beginning May 8], prefectures with more infections compared to the week from May 8 are shown in darker color. This is not accurate, but it can be used as an indication of the current infection status.
- Tap [Core fixed-point Hospitalization This Week/Last Week] to color-code whether the number of Covid-19 patients hospitalized in core fixed-point hospitals has increased over the previous week. Recently, hospitalizations may increase before new cases increases, or conversely, hospitalizations may stop increasing while new cases are increasing.

This page does not estimate the actual number of infected persons
It is said that the actual number of patients occurring can be estimated from the sentinel surveillance, but upon trial, we determined that it is difficult to estimate with high accuracy because the estimation method and the variation in patient identification status in each period prior to May cannot be fully reflected.
For this reason, the number of patients is not estimated on this page.
For estimates, please refer to the estimates posted by Sapporo Medical University on its website.
Publication of the number of inpatients will end as of midnight on March 27, 2024
The number of inpatients in this article was published on March 29, 2024, and the data as of midnight on March 27, 2024, will no longer be published.

About advertisements displayed on this page
This site is operated by a small business owner on our own, without any specific sponsorship or subsidy at all.
For the sake of business continuity, we are displaying Google Adsense advertisements on this site, as well as other articles on our blog.
Data source, etc.
Latest number of infected cases per fixed point
We are manually transferring the data from the PDF file in the MHLW “Press Release on New Coronavirus Infections (Outbreak Status, etc.) June 2023-“.
If the data will be published in csv or other formats, it will be easier.
Core fixed-point Hospitalization
The data was compiled using Microsoft Excel/Power Query from an Excel file provided in the National Institute of Infectious Diseases : Infectious Diseases Weekly Report.
Number of infections per fixed point before May 8, 2023
Press Release on New Coronavirus Infections (Outbreaks and Quarantine Cases) May 2023
The Excel file “(Reference) Total number of fixed-point medical institutions and number of reports per fixed-point medical institution (weekly data from October 3, 2005 to May 7, 2023)” is used here.
The Excel file is 9.3 MB in size, but it is oversized due to the large number of blank cells even in the areas that do not contain data.
Please note that after May 8, the tests are self-paid.
The data before and after the COVID 19 moved to “class 5” are shown consecutively, but in reality, there is a significant difference in conditions.
After May 8, less people are getting tested because of the co-payment for testing in case of medical treatment for covid 19.

Therefore, the figures after May 8 are considered to be lower than those before that date.
About the code used on this page
Charts are drawn using chart.js.
About Map Data
Using SVG Map of Japan published by Geolonia, Inc. with slight modification such as adding an id.
The license of this map data is GFDL (GNU Free Documentation License).
English translation
The translation into English is an automatic translation using DeepL with some manual modifications.
There are some points that are not fully covered. We apologize for any inconvenience.
